General questions
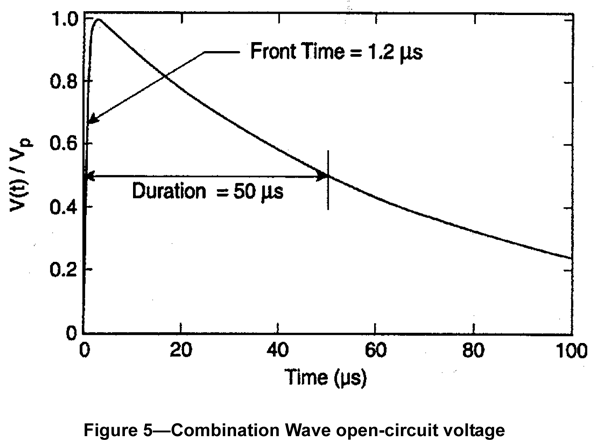
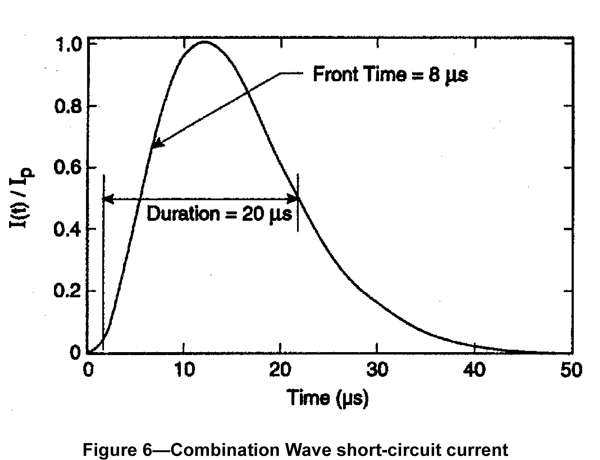
An impulse surge is an overvoltage event with a fast, initial rise time, usually only a few hundred millionths of a second. It then decays over several hundred millionths of a second until it returns to normal voltage levels. The typical voltage portion of an impulse surge has a rise time of 1.2 µs (1.2 millionths of a second) and a decay to half of the peak voltage level of 50 µs (50 millionths of a second). It is accompanied by a current surge wave form with a rise time of 8 µs and a decay to half of the peak current level of 20 µs.
The impulse surge is typically generated by electrical switching of large motors and switches. It can also be from nearby lightning, generator switching at the utility, or transformer failures. Internally generated impulse surge events can be as high as 6,000 volts and 3,000 amps from the switching of large motors within a facility electrical distribution system. They are not usually occurring in a systematic fashion, but rather in a random series depending on the on/off cycle of the large motors in the facility.
The impulse surge is typically generated by electrical switching of large motors and switches. It can also be from nearby lightning, generator switching at the utility, or transformer failures. Internally generated impulse surge events can be as high as 6,000 volts and 3,000 amps from the switching of large motors within a facility electrical distribution system. They are not usually occurring in a systematic fashion, but rather in a random series depending on the on/off cycle of the large motors in the facility.
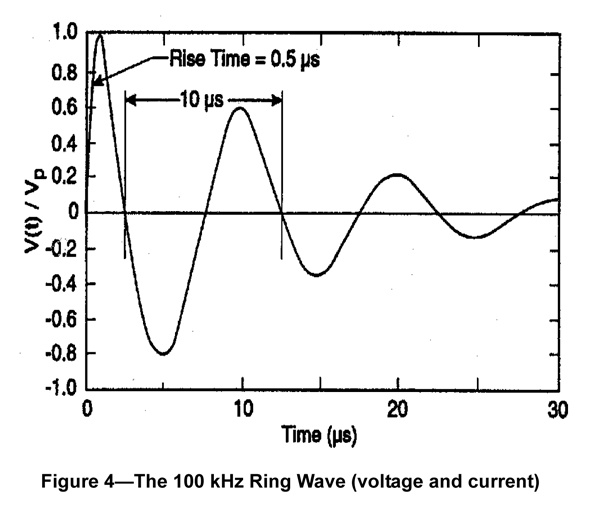
A ring wave surge, also called an oscillatory ring wave, is most often created by electronic switching. This occurs when a switch-mode power supply, bridge rectifier or variable frequency drive rectifier turns on and off several times per cycle to convert an A/C voltage wave form to a D/C voltage wave form. This is done to draw current in pulses during the conversion process. These current pulses create in inductive “kick” on the voltage sine wave, forming oscillatory ring wave surge events.
The ring wave surge events can be as high as 6,000 volts and 500 amps from the A/C to D/C switching of every VFD, PLC, computer, lighting controller, LED driver, and anything else with a power supply. They are typically in the 2,000 volts or lower range, but they are occurring four to six times per cycle in most equipment. That is anywhere from 864,000 to 1,296,000 per hour. Depending on their voltage and current levels, they can travel significant distances within the facility electrical distribution system.
When these ring wave surge events reach a point of resistance they can create heat and, eventually, cause “hot spots” or “blisters” to form, interrupting the flow of power or data. They are a primary cause of the indeterminate glitches, resets, reboots, and reprogramming errors that plague manufacturing facilities, and can cause downtime, lost production and missed deliveries.
Harmonics are created by electronic equipment with nonlinear loads drawing in current in abrupt short pulses. The short pulses cause distorted current waveforms, which in turn cause harmonic currents to flow back into other parts of the power system. Harmonics are especially prevalent when there are many personal computers, laser printers, fax machines, copiers, or medical test equipment, fluorescent lighting, uninterruptible power supplies (UPSs), and variable speed drives all on the same electrical system.
Harmonics degrade the level of power quality and its efficiency, particularly in a commercial building or industrial facility. In general, most buildings can withstand nonlinear loads of up to 15% of the total electrical system capacity without concern. If the nonlinear loads exceed 15%, some non-apparent negative consequences can result.
Common problems caused by harmonics:
a. Overloading neutral conductors
b. Overheating transformers and increased associated losses
c. Nuisance tripping of circuit breakers
From an article by Agilent Technologies
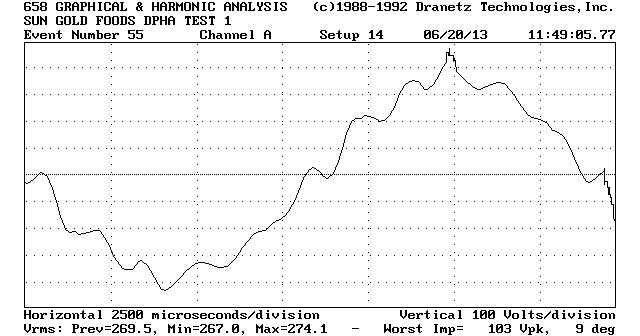
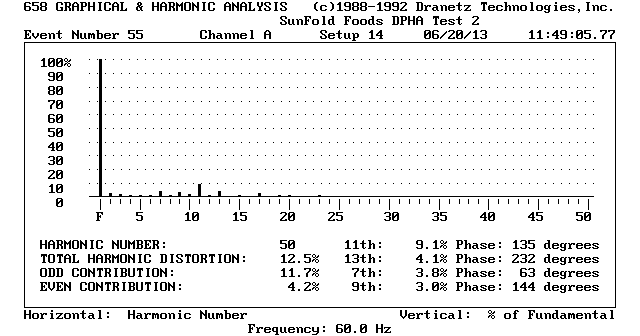
No, they are not. Harmonics are multiples of the 60 Hz wave form, which are added to the base wave form and cause distortion. This distortion creates a flowing multi-peaked wave form with additional waste energy, resulting in heat buildup within the system. Oscillatory ring waves are individual surge events with sharp spikes and high voltage peaks. They may, or may not repeat over time, whereas harmonics are continuous repetitions of the distortion. The differences can be seen in the following two sets of charts:
Harmonic Distortion Harmonic Distortion Percentages
Surge Events False Harmonic Analysis of Surge Events
Harmonic filters will reduce the true harmonic levels, but will do nothing for the surge events. Some surge protective devices will reduce or remove the surge events, but will do nothing for the harmonics. Because it is very possible for a harmonic analysis to falsely identify a surge problem as a harmonic problem, it is critical that the individuals conducting the tests know the difference and be able to correctly analyze the images to determine the true power quality issue and the correct remedial equipment required.
No, they are not. LED Drivers and lights are growing in use every day. Major re-lamping and redesign projects converting to LED lights for commercial and industrial facilities for internal lighting, parking lot and safety exterior lighting, and even signage are starting every day. Unfortunately, after a year or two in the field, they are finding that the LED Drivers are the weak point in the system and are beginning to fail from the cumulative damaging effect of the ring wave surges on the system (see question #2 above). The LED lights are fine, but they don’t work without the LED Drivers.
Some LED Driver manufacturers have included surge protection in their designs in an attempt to counter this cumulative ring wave surge event threat. The problem is they are using standard clamping, voltage responsive surge protective devices (SPDs) that are designed for the impulse surge, not the ring wave surge. The standard clamping, voltage responsive SPDs react to the voltage level of the surge and turn on when the surge voltage reaches a point outside the normal voltage envelope. This means for a 120 Vac circuit the surge must rise to 212 Volts above or below the zero line before the standard clamping SPD can even begin to react. By the time the standard clamping SPD has become fully operational and is able to remove the remaining portion of the surge, the extremely fast rise time of the ring wave surge means that a significant portion of the surge has bypassed the SPD and is going down line to the LED Driver.
But, just as there are two different types of surge, the impulse and the ring wave, there are also two different types of SPD design, the standard, fixed, or threshold clamping, voltage responsive type SPD design, and the frequency responsive type SPD design, sometimes called by its marketing term, “sine wave tracking”. This is not how the frequency responsive SPD works, it just describes how the end results appear on the better performing SPDs of this type. The amount of surge not addressed by the SPD, called let-through voltage or LTV, and left on line to go down to the LED Drivers, is often only a few volts off the sine wave, depending on where on the sine wave the surge originated. Because the frequency responsive SPD reacts to the frequency of the 100 kHz ring wave and not the voltage, it begins to respond almost immediately when the surge first deviates from the wave form. It then removes whatever voltage is at the high frequency, leaving the 60 Hz, normal voltage to pass downline and service the connected LED Drivers.
LED lighting systems are not inexpensive. The low energy consumption and the promised long life can make the investment pay off in the long run. Doesn’t it make sense to protect that investment with a surge protective device that is designed to address the primary threat to that investment?
The National Electrical Code (NEC) states, in Article 250.53(A)(2) Supplemental Electrode Required, “A single rod, pipe, or plate electrode shall be supplemented by an additional electrode of a type specified in 250.52(A)(2) through (A)(8).”
“Exception: If a single rod, pipe, or plate grounding electrode has a resistance to earth of 25 ohms or less, the supplemental electrode shall not be required.”
(3) Supplemental Electrode, “If multiple rod, pipe, or plate electrodes are installed to meet the requirement of this section, they shall not be less than 1.8 m (6 ft) apart.”
But, it includes an, “Informational Note: The paralleling efficiency of rods is increased by spacing them twice the length of the longest rod.”
To get the best effect from using two or more grounding electrode rods, they should be spaced at least twice the length of the rods apart. An 8 foot rod would require that the second rod be no closer than 16 feet. If using three 8 foot rods in a tri-pole grounding system, the three rods would each be 16 feet from the other two rods in the equilateral triangle. The longer the grounding electrode rod, the farther apart the rods should be placed.